corona-model
- How Would You Manage COVID-19?
- USA Current Trend
- How Important is Lockdown?
- How Important is Testing?
- Taiwan’s Success Story, An Example for the World
- The USA Is Not Significantly Flattening the Curve
- Discussion/Methodology
- Contact
How Would You Manage COVID-19?
Note: this model is being updated frequently as policies change, features are added and bugs are discovered. Check back often for latest updates.
Management Options
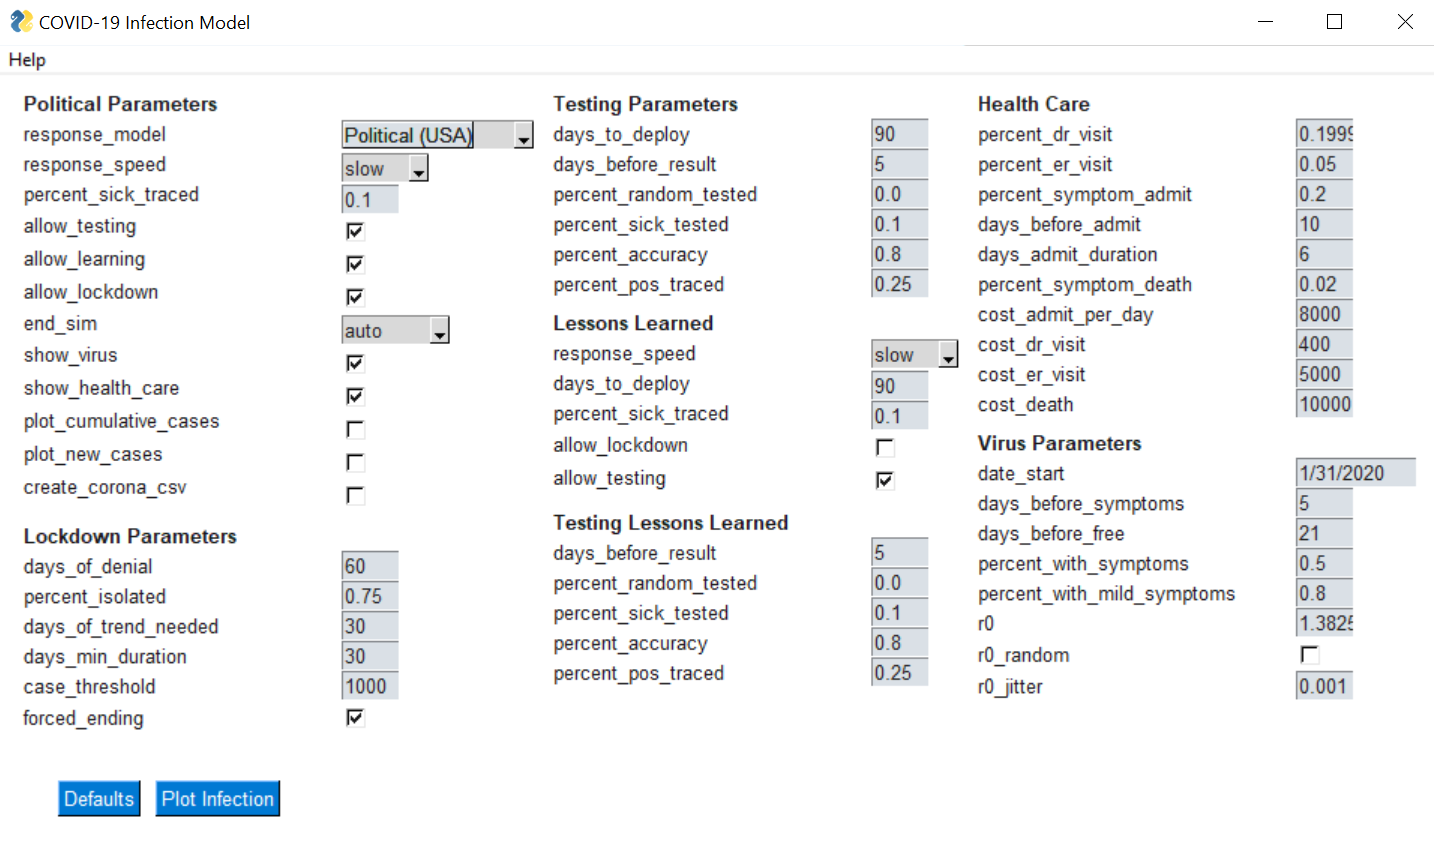
This program is intended to explore the political choices available to confront a pandemic. Each choice involves a policy decision that has life or death consequences.
- Do we spend tax money on testing or do we give tax breaks to the rich in an election year?
- Do we focus on early containment/mitigation or gamble with the hope that it will just go away?
- How many deaths will occur as a result of our decision?
Influential Parameters:
- How quickly we react to the crisis
- Percent sick traced outside lockdown
- Days of denial
- Early end of lockdown
- Days before test results
- Lessons learned
- Health care quality
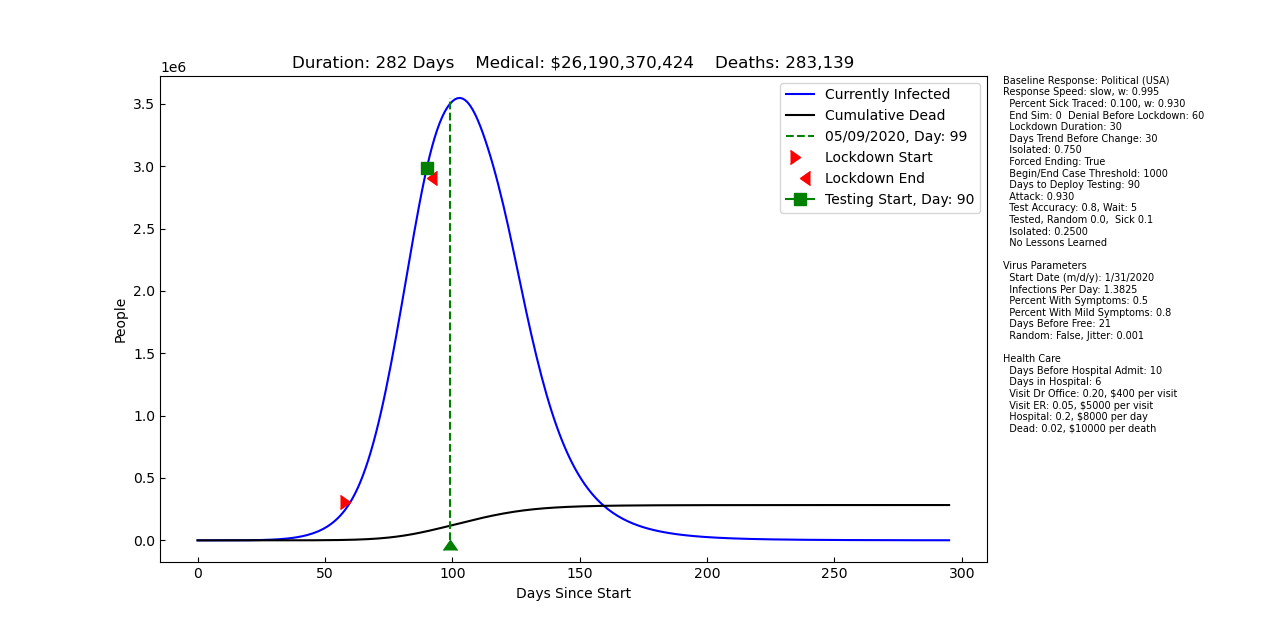
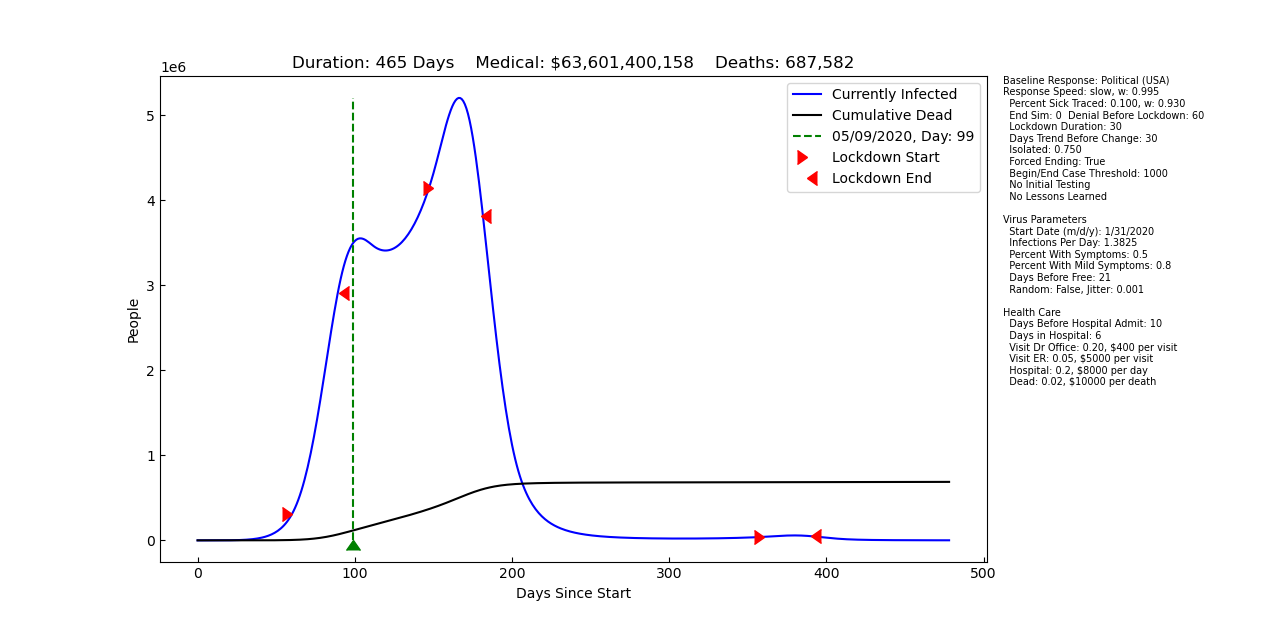
USA Current Trend
This Assumes We Start Disciplined Testing and Isolation
How Important is Lockdown?
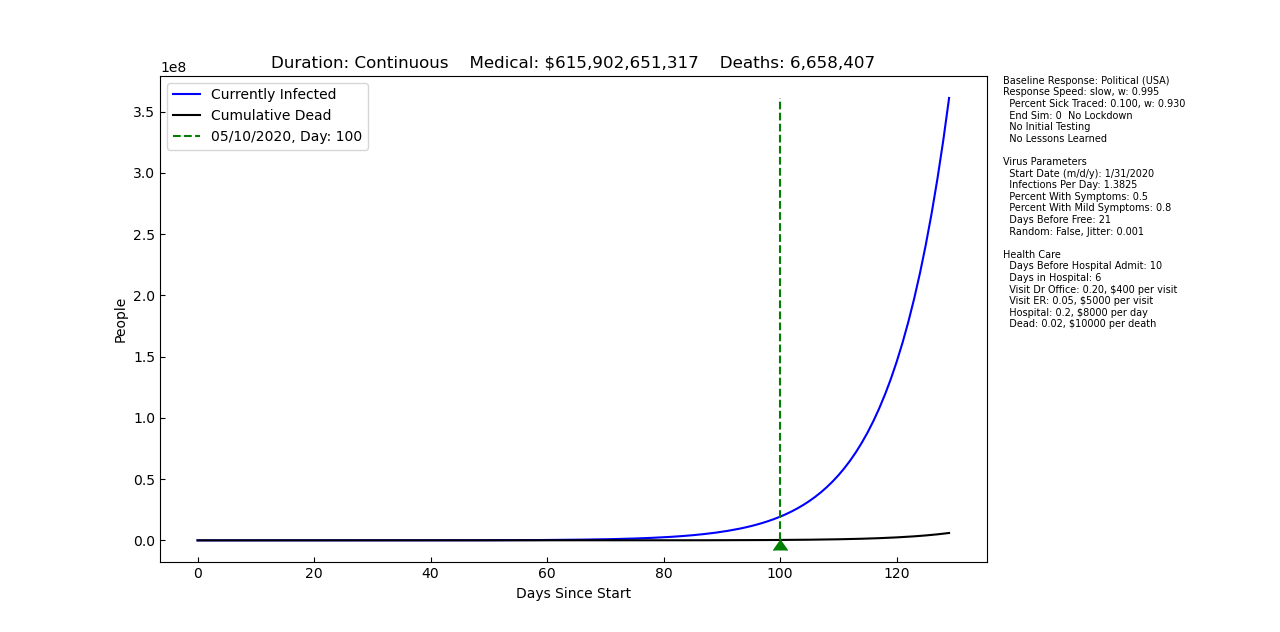
What If We Just Ignored the Virus?
If We Start Lockdown Early, We Will Prevent Economic Chaos and Suffering
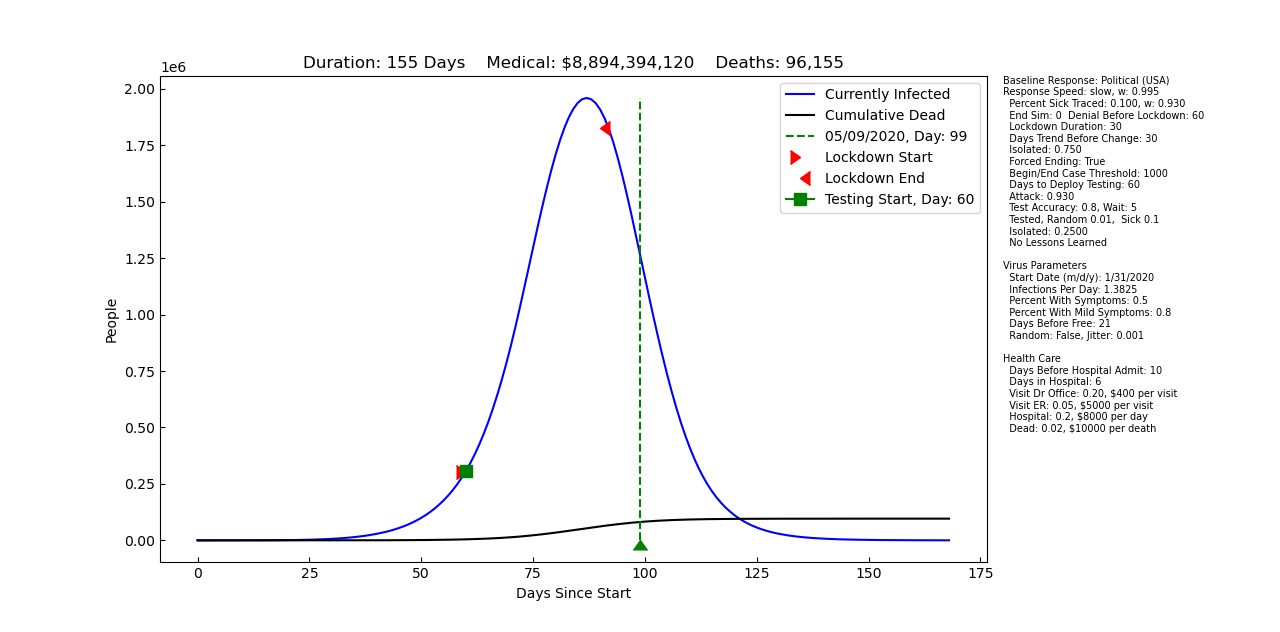
How Important is Testing?
What If We Eliminated Testing?
If We Start Testing Early, Many Lives Can Be Saved
A Small Amount of Random Testing and Tracing Makes a Big Difference
Early Test Results and Isolation Could Eliminate Need for Total Lockdown
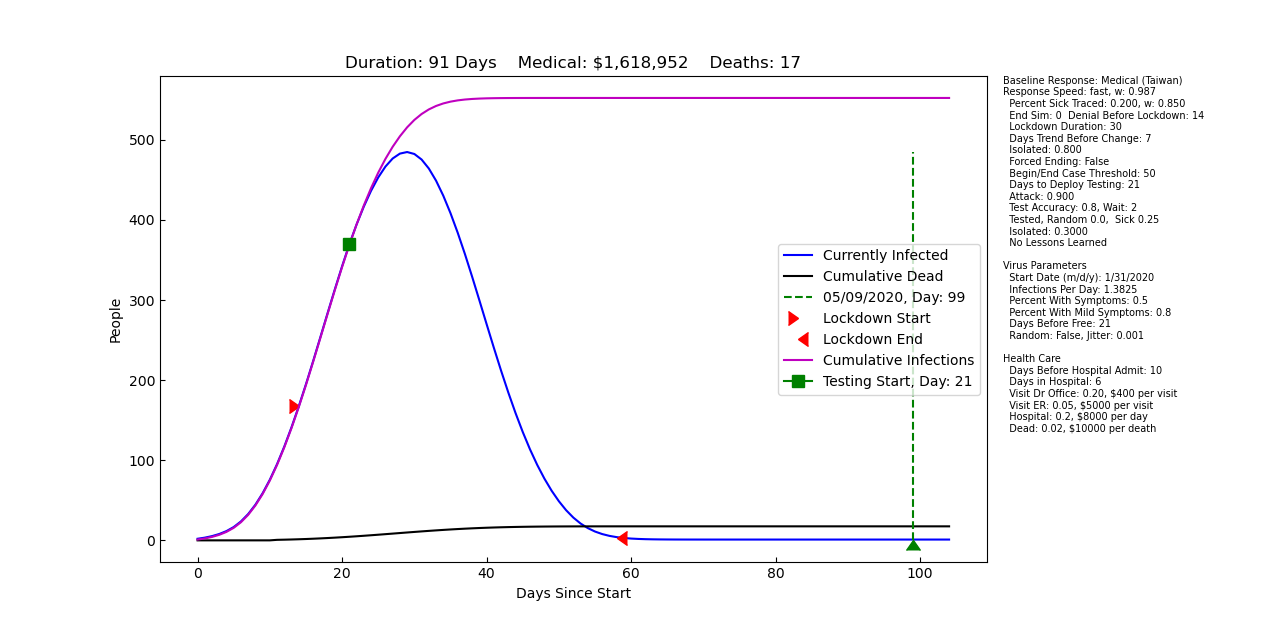
Taiwan’s Success Story, An Example for the World
With 23 Million People and Very Few Deaths, Taiwan Moved Quickly
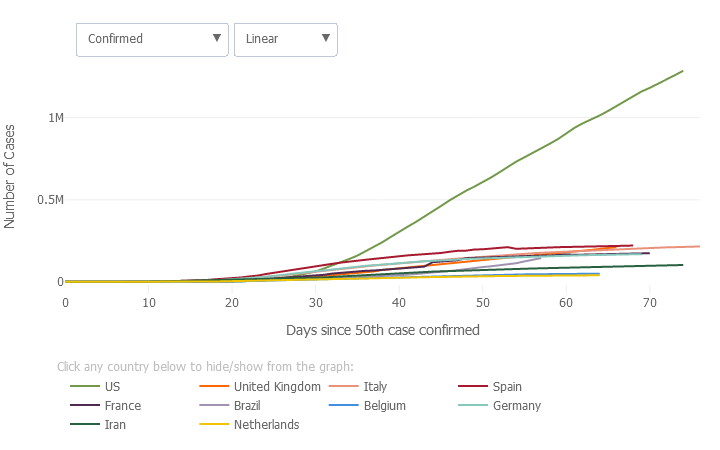
The USA Is Not Significantly Flattening the Curve
At least, at this point, thanks to lockdown, case growth appears more linear than exponential. When lockdown is lifted, without deployment of lessons learned (testing, etc), we will go back to exponential.
Johns Hopkins Coronavirus Resource Center, May 9, 2020 Link
How Aggressive Do We Need to Be?
The city of Seoul, South Korea, on Saturday ordered all bars and nightclubs in the city shut down indefinitely just three days after people in the city were told to begin “a new daily life with Covid-19.”
According to a report from The New York Times, the closure comes after a 29-year-old man tested positive for COVID-19 on Wednesday after he visited three nightclubs in the Itaewon area in the city last weekend. As of Saturday, officials said they were tracking down more than 7,000 people who had visited five nightclubs in the region, according to the report.
“Just because of a few people’s carelessness, all our efforts so far can go to waste,” Seoul Mayor Park Won Soon said at a press conference Saturday.
According to The Times, the mayor said at least 40 infections had been linked to nightclubs, though Kwon Jun Wok, a senior disease-control official, said Saturday that just 27 reported cases had been linked to the venues. Park said 40 cases included the 27 in Seoul, 12 in Gyeonggi Province and Incheon, and one in Busan, according to The Korea Herald. Link
Discussion/Methodology
Simulation Time Delta
I’ve used a very simple infection model, R infections per day per person. Once R infections have spread by a single source, the source no longer infects. This is reasonable in the average of 330 Million people. An interesting experiment is to randomize the R value and you will find that chance can have a dramatic impact, however the trends for testing, lockdown, tracing, etc remain consistent.
True Number of Cases
Things get interesting here. While the replication factor changes as mitigation and containment measure are introduced, I could never correlate the conventional estimate for R0 (2.2 to 2.6) with any reasonable model based on published number of cases. In my opinion, the number of actual cases is a minimum of 2X and more likely 4X what is being reported by CDC. In the latest model, I have re-calibrated to approximately 3X instead of 2X as shown earlier. As of May 4, news outlets are reporting that the true number could be as much as 10X government figures. This uncertainty is due to the lack of testing in USA. Without routine testing, we can only make our best guess as to the true numbers, however, this is primarily a problem with the absolute numbers being reported. Differential trends as a reaction to policy implementations (testing, lockdown, etc) will be largely unaffected. Confused and frustrated by the lack of a comprehensive federal plan for testing? Me too.
How Do We Model Transitions?
How quickly the transitions to and from lockdown occur can have a major impact on the number of infections. The model uses simple recursive sections to emulate transition times ( lockdown, testing, etc).
How Does Lockdown Work?
Intervals of continuous increases and decreases are counted and, after an initial denial delay, the count is compared against a threshold to begin and end lockdown. The lockdown duration, thresholds and isolation (aka shelter in place) compliance rate can specified in the lockdown menus. As an option, lockdown may be forced to end after the specified duration regardless of trend data. Future versions may utilize a moving average based threshold to make it easier to introduce randomization.
Who Gets Sick?
Some percentage of the infected public will show symptoms of the virus. We classify the symptomatic public in two broad categories, severe and mild. Someone with severe symptoms is considered to be diagnosed at a doctor’s office, no testing is required, the infection is labeled “suspected” and they are placed into isolation. Someone with milder symptoms may or may not see a doctor to confirm their infection. These percentages can be adjusted in the virus menu.
How Is Testing Modeled?
Some percentage of people with milder symptoms will be considered candidates for testing. To model a coordinated test plan, random (aka drive-up) testing may be available and some percentage of the infected public will be tested this way.
Testing can be specified to guarantee some average ability to correctly identify an infection. The number of days to receive a test result can also be specified. These parameters may be adjusted in the test parameter menus.
Who Gets Traced and Isolated?
Those with severe symptoms are assumed to be placed into isolation. Their contacts are immediately traced and a small fixed percentage of infections are placed into isolation as a result. Future versions may handle this in a more sophisticated way.
Those with milder symptoms and positive test results are isolated and the percentage of related infections traced and isolated is weighted by a “forgetting factor” of 1 / N, where N = number of days waiting for the result.
How are Deaths Computed?
A percentage is applied to those with more severe symptoms, i.e. those who visit a doctor with indications that result in a “suspected case” diagnosis.
Contact
gmail: corona.python